10x More Data & 25x more updates – Gain new insights with INSAR Monitoring
InSAR stands for Interferometric Synthetic Aperture Radar and is a proven technique for measuring ground movements. Satellites record images of the Earth, and these images can be combined to measure movements of the ground surface.
The standard deviation of location and height of the measurement points is 1 meter for high resolution date and 2.5 meter for standard resolution data. So InSAR is particularly useful for monitoring dynamic position changes.
Contact us today for a free demonstration and technical evaluation!
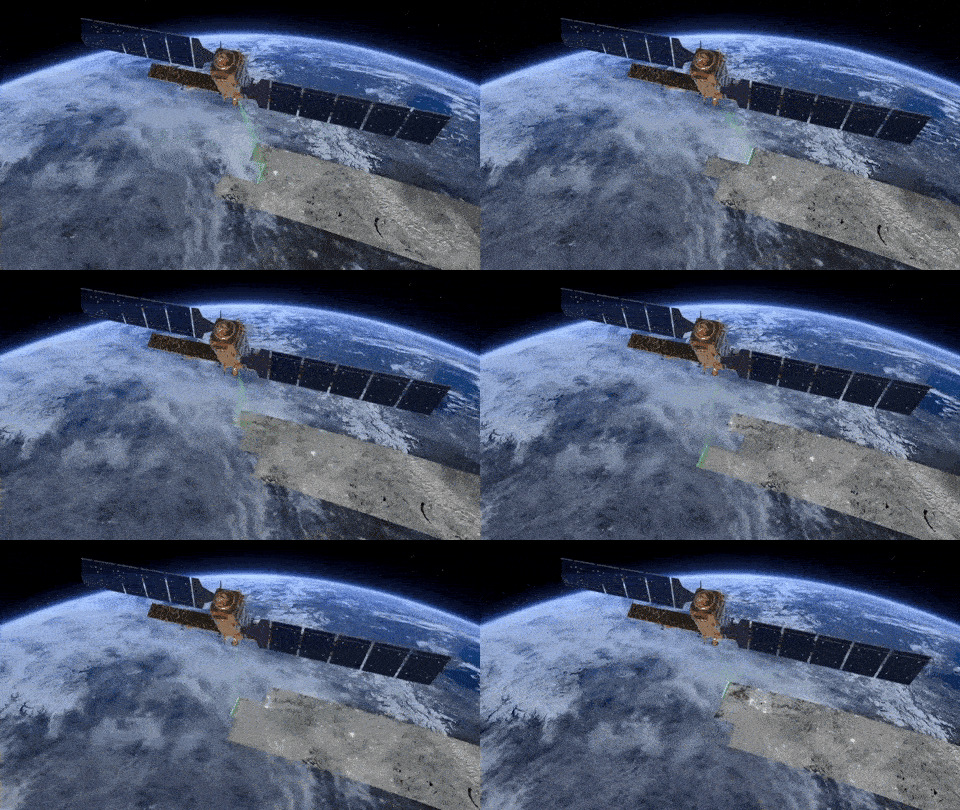
Product Features
Gain New Insights
The large number of measurements and weekly updates provide a detailed insight in the slope and speed of subsidence. A sudden drop of a small area might be a reason for local inspection. Wider gradual subsidence tells a different story.
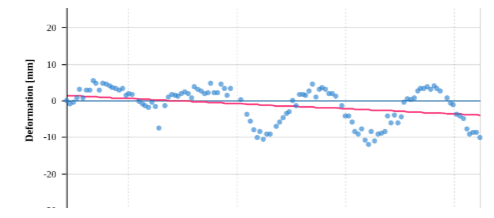
Millimetre Accuracy
Time series show how objects have moved since the previous measurement. Compare measurements on millimetre-scale.
No Prerequisites
InSAR is based on radar reflections from infrastructure, the measurements are not related to pre-determined physical points on the ground.
Weekly Updates
Measurements are updated weekly. Discover deformation trends in objects as they happen.
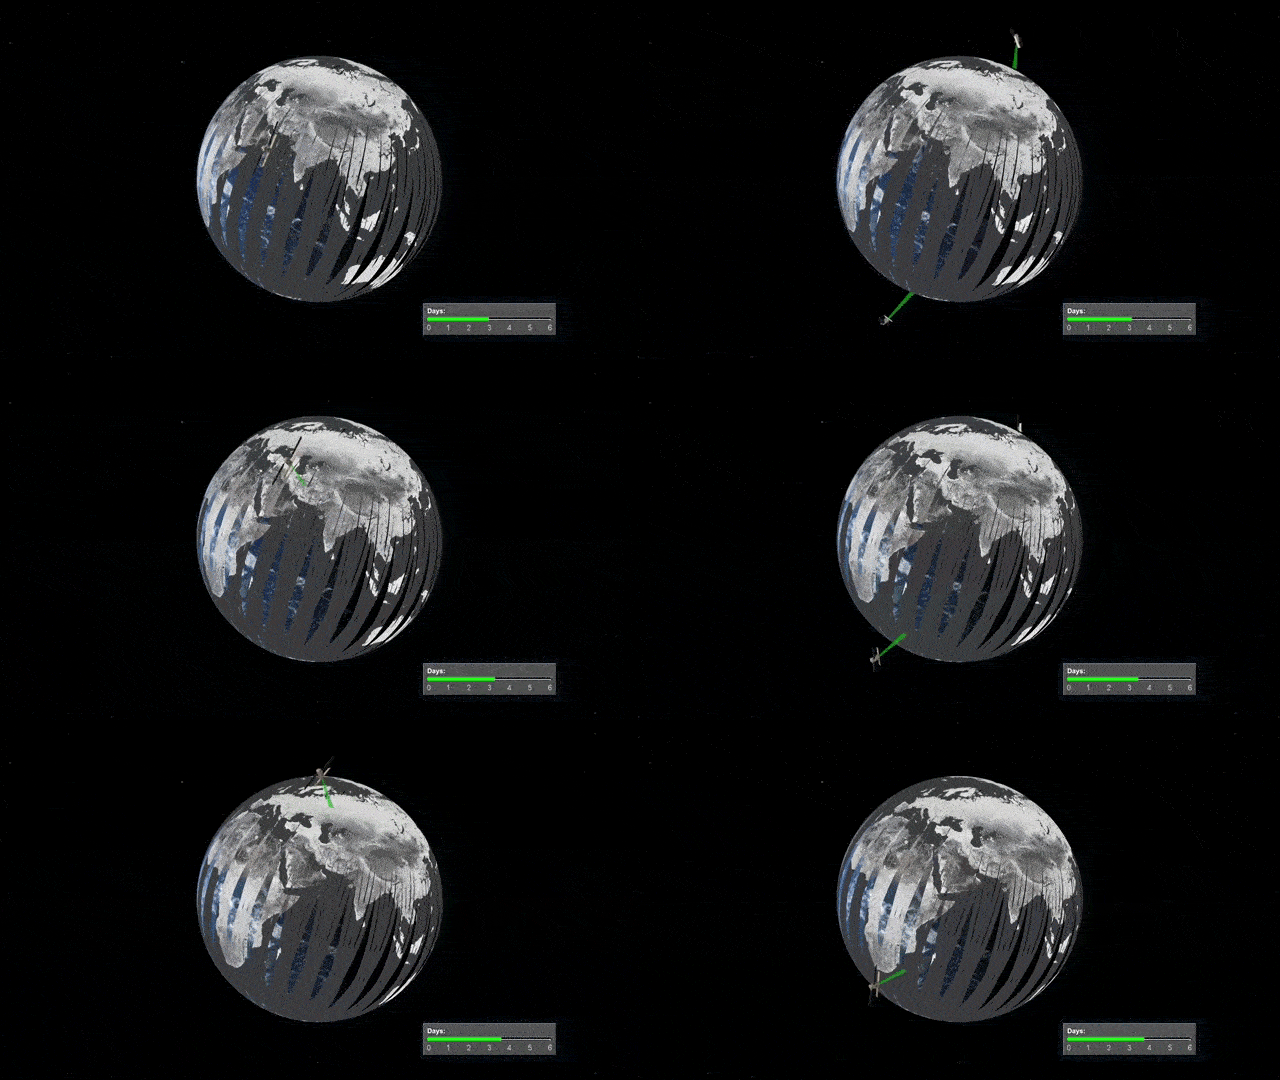
100 m2 up to 10,000 km2
InSAR Monitoring provides subsidence measurements of single buildings, bridges, mines, whole neighbourhoods and areas up to 10,000 km2.
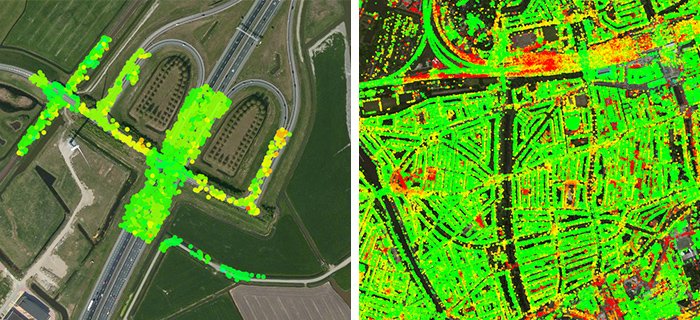
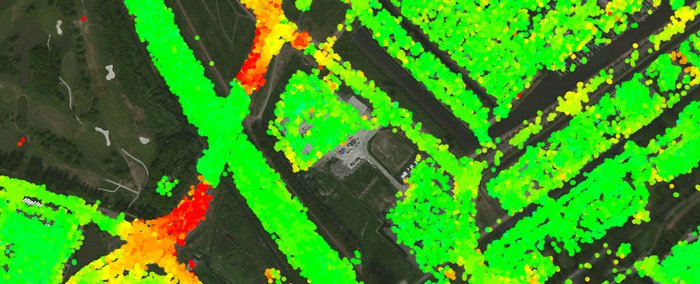
100,000 measurements per km2
Our maps contain up to 100,000 measurements per km2 over large areas. A quantum leap compared to conventional levelling methods.
25 years back in time
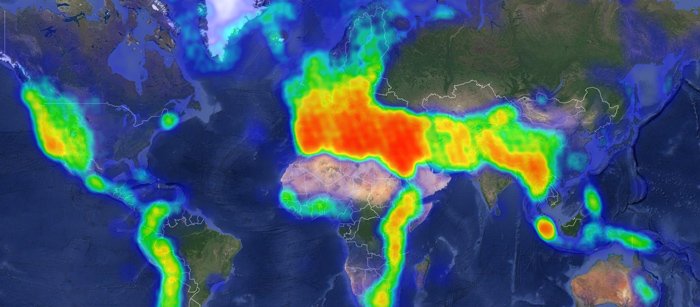
Our data archive goes back to 1992 and covers 70% of the Earth’s land. With that data we can measure subsidence that occurred in the past.
Solutions Per Industry
Mining Stability Monitoring
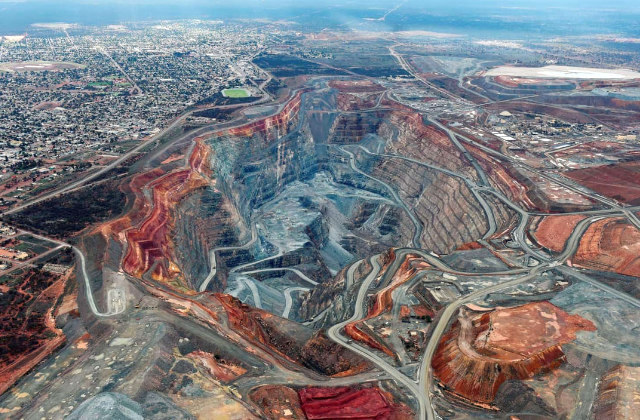
Mining stability Monitoring is a service to provide persistent geotechnical risk surveillance to identify areas of abnormal surface movement over time. Mines need to be up and running 24/7 and Geomotion can help achieve that goal by identifying instabilities early.
By assessing time-dependent shape changes in InSAR data in our Antares Platform, geotechnical domain experts can identify patterns of instabilities. This is a direct pathway to improve asset management in mining operations.
Early Warning Communication
Three of the biggest companies in the industry trust us as their InSAR partner of choice. We pride ourselves on being world class field application engineers and we are on a mission to make InSAR the standard remote monitoring solution in the mining industry. Regular monitoring provides detailed, wide-area information on instabilities. Our Antares platform will provide you with early warning communication when potential problems are detected.
Interferometric Synthetic Aperture Radar (InSAR) analysis detects and measures surface movement and helps understand them in terms of structural or ground water changes.
Every mine is different and we’ve proven there is no standard InSAR solution that fits all so we tailor solutions to every project.
Tailings Dam Stability
The mining industry has workflows and safety practices like no other industry. We can assist in site production up-time, by using satellite data for forecasting maintenance. Areas that are moving with unexpected patterns need more attention than areas where the surface is stable. Groundwater is known to play a key role in this process, we help visualise the role of groundwater better. Our engineers and geoscientists work together with you and your geotechnical team to make sure maintenance planning is optimised and cost can be reduced.
Environmental risk management is a serious topic in the Mining Industry. Will it ever be possible to fully prevent a failure by using data? We are starting to understand the predictive power of these millions of remote sensing measurements, but they require a specialist to convert them into a correct and easy-to-understand statement about safety.

Stability monitoring benefits
- Prevent surprises – risk in mining is environmental
- Optimise deployment of surveillance crews and equipment
- Discover new insights about time dependent risks
Tailings Storage Facilities’ Stability
Each mine has several areas of high geotechnical risk, that each require dedicated iterative assessment. Tailings dams pose a special category of risk. Because of environmental issues in the recent past, most mining experts are now looking for continuous monitoring systems to predict instability better.
Solid tailings are often used as part of the structure itself and with the tailings being liquid or a slurry of fine particles groundwater, significant instabilities arise in a variety of ways that are usually not completely understood. With InSAR we can help this understanding: we characterise and quantify these time-dependent degradation processes on a wide area scale and identify different dynamic patterns. Monitoring these patterns continuously is now a proven permanent risk management method.
The deployment approach of remote and local sensors is different for any of the three raised tailings dam designs, the upstream, downstream and centerline.
Converting Measurements into Insights
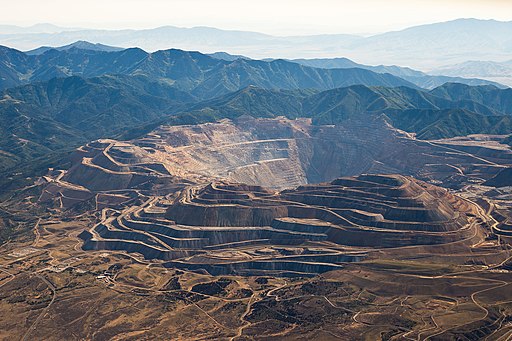
For (Stability Evaluation of) piles and dumps, but also for highwall slopes or longwall slopes, we take groundwater levels into consideration, as well as soils and other geotechnical influences. These factors impact both the InSAR measurements and the resulting insight. We are building up a library of relevant deformation patterns.
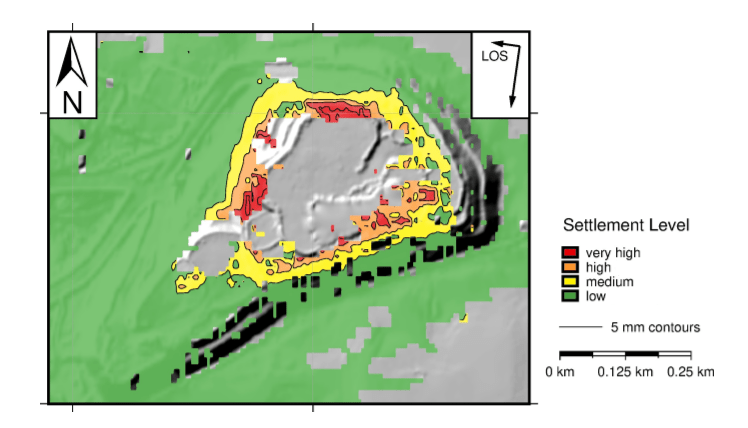
We create short term “iso-deformation” maps every time the satellite acquires an image and rank deformation in the mine over the last couple of days by way of a 4-stage “traffic light” alerting system. For most customers, we typically show two different lines of sight, showing different parts of the mine. These Contour Maps are different from our time series products.
For more information on the relative merits of both these products and how they can help discover different stability issues, talk to our specialists.
Full Mine Site Coverage
InSAR Stability Monitoring can provide early warning of ground movement across the entire mine site, including the tailings storage facilities. This warning system triggers operators when to mobilise for visual inspection or assign other available site resource like ground-based radar or drone-based systems for an emergency survey of the site.
A key benefit of our system is to pre-process the InSAR data in our platform to a set of thresholding criteria for ground motion dynamics, resulting in a site-specific traffic light function. The data we share with your company seamlessly integrates with all industry standard mining software. A new dataset can be made available every time satellites revisit. For some locations this is bi-weekly but other sites are monitored every 5-6 days.
The World’s Most Reliable InSAR Processing
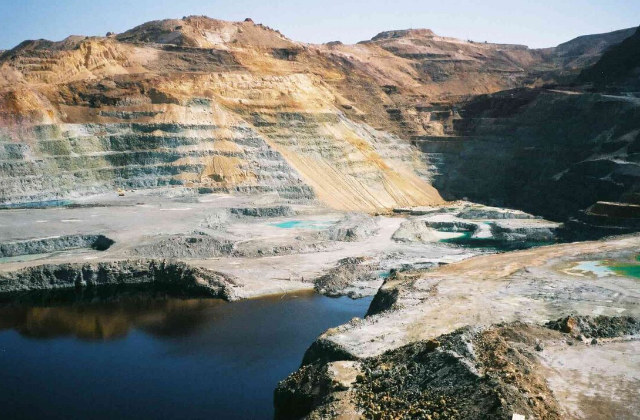
At SkyGeo we know how the complex InSAR machine works inside and out; we know what works well – and what doesn’t when assessing all the different aspects of the mine stability. We have built our own code base to do interferometry; we do not rely on black-box third party software. We task and work with all available satellites and configure a service to optimise continuous risk monitoring. Moreover, we have built a progressive rigorous process to do Quality Assurance auditing of our InSAR for Mining applications that has met the rigorous quality standards imposed by some of the largest and most demanding organisations in the world like ExxonMobil and Shell.
Civil Engineering
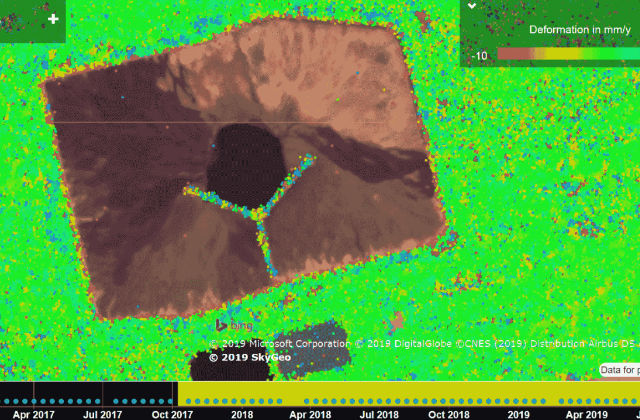
Let Geomotion configure an InSAR Monitoring solution for you – with millimetre accuracy, up to 25 years back in time and 100,000’s measurement points per km², each with a graph of deformation over time. Geomotion data is often the best predictor for mean time before failure of the assets. Risk management practitioners use this for predictive maintenance.
We monitor subsidence for many civil engineering projects
- Roads
- Dikes
- Railways
- Dams
- Bridges
- Tunnels
- Airports
- Pipelines
- Neighbourhoods
- Sewage Systems
- Buildings
- Water Defence
Subsidence Data for Every Stage of the Project Life Cycle
Site Selection
Determine existing surface motion during site selection processes. Support the design and the optimisation of the ground instrumentation network. Geomotion provides unique support in reconstructing past ground motion patterns, which could potentially affect constructions. Using a historical archive of satellite imagery, Geomotion can identify unstable areas prior to construction and reconstruct their displacement to assist in the planning of new sites. Monitoring with satellite data minimises survey time and cost compared to traditional measurement techniques.
Development
Monitor impact of construction activities on nearby buildings and infrastructure. Complement traditional monitoring by extending motion measurements to a wider area. Solve model uncertainty. The density and precision of measurements can be used to verify model predictions of ground deformation. By mapping the evolution of ground displacement during construction, engineers can better understand the relationship between activities and the onset of any related settlement. Geomotion offers thousands of measurement points over large areas, at a fraction of the cost of traditional monitoring. It also increases displacement information beyond excavation surroundings, to determine the extent of any deformation occurring within a wider area.
Maintenance
Assess the stability of assets over time to monitor that deformation remains within design parameters. Control impact on assets of deformation occurring in adjacent areas. Regular monitoring of post-construction displacement can identify structural weaknesses. Identifying motion that could indicate a structural weakness helps engineers to determine if actions should be taken. Moreover, InSAR Monitoring provides deformation maps to assess areas at risk.
Energy
Geomotion tracks subsidence and heave over producing fields all over the world. InSAR Monitoring gives you up to 100,000 measurement points per km², each with millimetre accuracy. For each measurement point, deformation over time is related to sub-surface effects of production. Reverse engineer this surface footprint to understand your reservoir.
Trusted by the world’s largest oil & gas companies
Integration with Geomechanical Data and Models
Production geologists, geophysicists and reservoir engineers all need to validate their subsurface models against a permanent backdrop of incomplete data. Pressure drop over time in a producing field can lead to reservoir compaction, movement of the overburden and subsidence of the surface above the reservoir. A particularly common effect in depleting fields is fault reactivation, induced by differential compaction between adjacent compartments. One fault compartment is more depleted than the other.
This compaction can be costly for production and for facilities above the ground. Fluid flow and compaction patterns in a reservoir will change over time. Geomotion adds a dimension here, because subsurface mass transport leaves a dynamic footprint on the surface; you can track subsidence and uplift with unprecedented accuracy and completeness. The knowledge of these dynamics can support your model’s validation. InSAR Monitoring complements seismic profiles, and widely spaced data from surface tiltmeters to improve geophysical models.
Enhanced Recovery
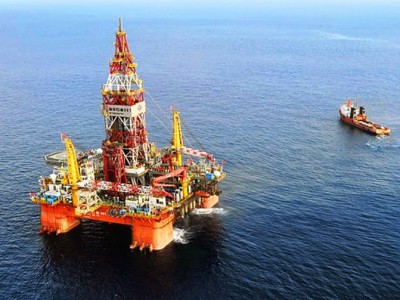
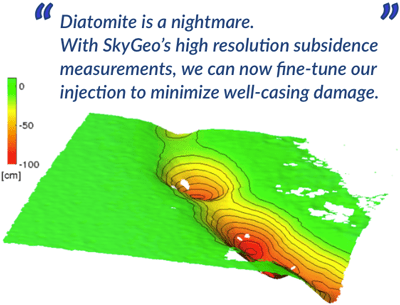
The tightly spaced Belridge diatomite in California has historically seen high subsidence rates up to 30 cm / year. Our customer has optimised water-flooding strategy in this field. Injection in the high-porosity, low-permeability diatomite has notoriously unpredictable and dynamic effects. Our product provides continuous updates on subsidence and uplift with millimetre precision over the entire field. Insights in regional and local under-, or overshooting gets converted into continuous adjustments in injection flow rates with high granularity. The payback of this approach has been immediate in the form of reduced incidence of well-casing damage in the field.
High availability
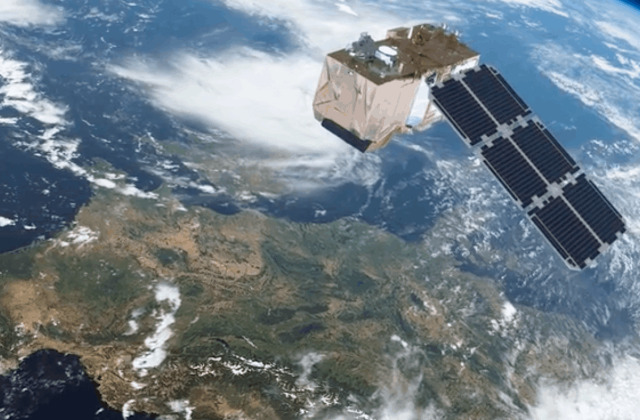
Effective asset management means mitigating surface deformation and subsidence as it happens. This requires insight in surface dynamics regardless of daylight, cloud cover, weather and limits to safe access. The radar interferometry technology meets all these requirements and is widely accepted in geodetic applications. Since these deformation data are gathered by satellites and processed with our algorithm, we update our users’ deformation data automatically and periodically. For each asset’s specific requirements, we configure the radar satellite mission. We task data acquisition parameters on the satellite, (such as resolution, image size, wavelength and frequency of image acquisition) to best monitor our customers assets.
Installations and Infrastructure
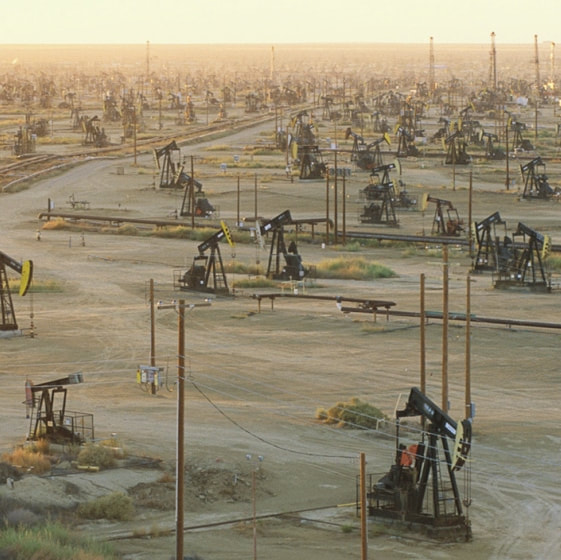
On the distance scale of installations for production, transportation, storage and processing, our products measure deformation in the infrastructure with a high degree of completeness. These insights into deformation dynamics will reveal for example high gradients in deformation rates, where high stresses likely affect the asset. These early indicators can inform further inspection. Our subsidence measurements have been validated with ground-based measurements in many different installations all over the world.
Site Survey
The first step in a site survey is usually to map the surface geology and active faults. Remote sensing plays a valuable role because these tasks can be accomplished without capital spend or ground crews. A remote fact-finding mission will establish if there is autonomous movement along fault zones, and if so, at which rates and in which direction. This yields immediate insights for new and mature fields. The surface survey will give a complete overview of the surface dynamic events underlying deformation. We can access historical satellite data as far back as 1992 enabling a long term perspective on geological forces at work.
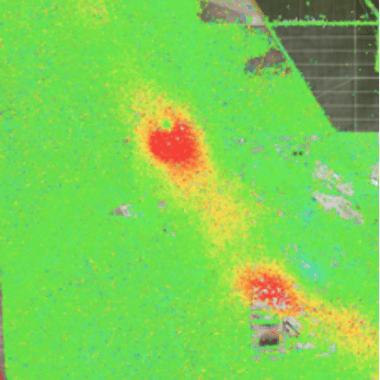
Detect displacement areas of unexpected uplift and understand the patterns of ground movement better. InSAR Monitoring provides an unprecedented combination of high density measurements, over wide areas, with millimetre accuracy.
Complement conventional data
Our products can be used to complement other data, such as (micro-)seismic mapping, downhole pressure gauging and tiltmeters. No capital expenditure is needed. In the case of horizontal drilling the mass displacement can follow unpredicted conduction pathways. Subsurface crack propagation and subsequent mass transport can be hard to predict or model. In both conventional and unconventional plays, local variations in stratigraphy and fault pattern can cause enough variation that model outcomes need continuous fine-tuning.
Any mapping based on satellite images – and deformation mapping in particular – is very information-dense: it typically yields several orders of magnitude more information than conventional terrestrial methods for surveying surface motion. The availability of all this new data of the earth’s surface motions also enables new, previously unimaginable applications. We make our maps with comparable accuracy, at a lower cost and no capital expenditure. The larger and the more inaccessible the area of interest, the higher the value added by remote sensing.
Surface measurements can help put quantitative constraints on geophysical models. Subsidence bowls tend to be symmetric even where the compaction in the payzone is not. Subsidence effects resulting from each compacting element are superposed, so subsidence bowls typically average out variations. Overburden anisotropy and slippage along fault patterns can affect the spread of subsidence. So vice versa, asymmetries in subsidence patterns combined with knowledge about overburden anisotropies or fault patterns can isolate “visible” compaction. The SkyGeo horizontal vs. vertical surface motion measurements can further improve compaction estimates thus constrained in the models.
Frequently Asked Questions
What is InSAR?
InSAR stands for Interferometric Synthetic Aperture Radar and is a proven technique for measuring ground movements. Satellites record images of the earth, and these images can be combined to measure movements of the ground surface.
How precise can you measure deformation?
The precision of each individual measurement is in the order of millimeters. This depends on the kind of satellite we use. By combining multiple measurements over time, we can derive the deformation velocity with a precision of around 1 mm/yr.
How is it possible that from 800 km altitude, such precision is achieved?
The distance is not relevant, the basis of calculating deformation is the use of the interferometric phase. Because the phase of the wave can be measured with sufficient precision, it does not matter how long the distance is.
The measurements originate from hard objects such as rocks, buildings, bridges or other infrastructure. How reliable are these points?
Very reliable. We only provide deformation measurements from reflections which do not change during the observed time interval. Major changes to the surface – like maintenance or resurfacing – will result in a change of the radar signal, and no reliable estimate is possible. The radar points are not selected manually by identifying hard objects, but by the criterion of an undisturbed radar signature.
What is the validity of an individual measurement?
InSAR relies on radar scattering to calculate the deformation data. The basic principles and the technology has been validated in hundreds of scientific papers and in thousands of cases. Nevertheless, we caution strongly against overly deterministic evaluation and interpretation of individual measurements points.
Can you influence the locations of the data points?
There are no sensors to be installed and we cannot influence the exact locations of the measurements.
What’s the typical scale of the area of interest?
We provide subsidence measurements of single buildings, bridges, mines, streets, whole neighborhoods and areas up to 10.000 km2. The smaller the area of interest, the higher the satellite resolution is required. The larger the area, the more favorable the economics become.
What is the measurement point density for my area of interest?
The data point density depends on many factors. We can assess the point density of your area of interest and optimize it for your business requirements. Contact us, we probably already have measurements of your area of interest.
How frequent can you measure my area?
We can measure semi-daily, depending on your requirements.
How does InSAR differ from conventional measuring methods?
InSAR is based on radar reflections from infrastructure, the measurements are not related to pre-determined physical points on the ground. This contrasts with leveling, tachometry, or GNSS (GPS) measurements, all of which rely on physical markers such as measuring bolts in infrastructure, underground markers, etc.
Aerial photography images are formed by reflected sunlight which is collected by a sensor, the camera. Radar images differ from these, because they are acquired in a much longer wavelength signal. The long wavelength enables the signal to travel through clouds. Furthermore, the radar does not rely on reflected sunlight, but acts itself as a source of radiation by transmitting pulses, which reflect on the surface. Finally, the radar measures the time between transmission and reception of the pulse, making it a distance measurement. Aerial photos cannot determine distance and are sensitive to directions under the influence of the lens. This is the essential capability enabling radar images to provide information about distance or distance changes (deformations), while optical instruments cannot.
How large is the deformation that you can measure?
It depends on which satellite is used but it is possible to measure changes of several meters with great precision provided that the radar signature of the earth’s surface has not changed. This is the case for large instantaneous movements like earthquakes and landslides, or large but slow movements in dry, undisturbed areas.
You claim to look back in time. Does that apply everywhere, and how far back can you look?
Radar satellites started recording surface movements in 1992. Since then the number of satellites and the resolution of the images have increased significantly. We currently have access to historical data that covers 70% of the earth’s land. We can use that data to calculate and visualise surface movements in your area of interest.
Can the measurements be made ‘absolute’ to link them to a National Height Reference System (NHRS)?
This is possible through the use of radar reflectors, where the precise location of the radar reflection point is known. Two variables must be distinguished: (i) the instantaneous absolute height of the point, for example in the NHRS, and (ii) the instantaneous absolute subsidence rate (ie, absolute altitude change of the point relative to the NHRS).
The value of a link to the NHRS should be critically considered. Just like GPS measurements are made in a reference system (‘datum’) compared to leveling measurements, the radar measurements are referenced – only in a different system. In most cases our measurements are about changes of the points over time.
In what direction does the satellite measure subsidence?
We measure motion in the line of sight from the satellite; in an East-West vertical plane, looking down in a 45-75 degree angle. If we do an analysis from different satellite viewing directions, multiple projections are measured. Based on this the absolute direction of the deformation vector can be determined, and we can distinguish subsidence from e.g. shear along a slope or horizontal deformation.
Can you measure horizontal motions?
Yes, we can measure horizontal motions. SAR measures the projection of ground motion onto the Line of Sight (LOS) direction. The horizontal motions also contributes to the projection and can thus be measured by InSAR. However, if we want to calculate the contribution of horizontal motions based on the LOS measurement from either one satellite or the decomposition of two satellites, there has to be certain assumptions. In general, it is true to say that the SAR is less sensitive to north-south movements; and if we neglect the contribution of ground motion from north-south direction, we can estimated the vertical & east-west motion with two satellites given the above assumption.
What is the horizontal resolution of InSAR?
This varies per satellite and depends on the look angle towards the surface. ERS and Envisat have a ground resolution of approximately 5 to 23 meters, and a sampling of approximately 4 to 20 meters. TerraSAR-X has a variable resolution, usually we use 3 by 3 meters. Radar images resolution should be interpreted differently compared to optical images. Within a radar resolution cell of 4 x 20 meters, an object with dimensions of less than 1 meter can dominate the reflection. For example, a lamp post covers a much smaller area than 4 by 20 meters, but can provide a useful reflection.
Do you use ESA’s Sentinel-1 satellite?
Sentinel-1 is a valuable source for SkyGeo but the satellite cannot be controlled for a specific monitoring task.
How are measurement points distributed in time?
We rely on the revisit frequency of the satellite.
What is the absolute geolocalization?
The absolute location has a standard deviation on the order of 1-2 meter, our algorithm is set to make sure we are measuring the same object every time and measures the motion of that object with
millimeter precision over time.
What is SkyGeo Maps?
SkyGeo Maps is a secure, online platform with your personalized maps and deformation data. SkyGeo Maps has a variety of tools to help you detect patterns in dynamic deformation. View the time series to understand the deformation dynamics over different distance scales: from 10m2 all the way up to 10.000 of km2. Contact us for a quick demo of SkyGeo Maps.
What are these colored dots in the deformation map?
The colored points are radar reflections that are consistent over time. The point density depends on the characteristics of the terrain. A very ‘smooth’ terrain (flat relative to the radar wavelength) provides little or no reflection to the satellite. Another area may be “rough” and reflects in all directions. It is important that the characteristics of an object do not change significantly between consecutive satellite recordings. We call this type of scatterers coherent. If a reflection remains consistent over time, we call it a persistent scatterer.
What does the color of the measurement points mean?
The color quantifies the extent of motion of the measurement point over a given interval – it can be either the total displacement or the slope of a fit over time, typically in mm/year.
What is the significance of the size of the dots?
The size of the dot is uniform for the map. The size is only adjusted for the sake of visualizing and pattern detection.
The measurements are ‘relative’. What does a strain rate of 0 mm / year mean?
All measurements must indeed be interpreted relative to one another, as from space is not possible to determine if any point can be considered stable. The interpretation is always “how does point A move relative to point B.”
However, the results need to be shown numerically in the deformation map. For this reason, a reference point is chosen. At this reference point, the strain rate is by definition 0 mm/year. The movement of all other points within the analysis is relative to the reference point.
How is the reference point chosen, and what is the physical interpretation of this point?
The exact location of the reference point is not relevant for deformation rate.
For the physical interpretation, however, this choice is relevant. All measurements are calculated on the assumption that the reference point is stable. Without prior knowledge of the physical characteristics of the area of interest, it is impossible to select an absolute stable reference point. This is a very important factor when interpreting the data, as it easily could lead to misunderstanding.
Note that this assumption is identical to leveling, where stable reference points are assumed. Although in case of leveling usually more physical information about the reference point is available, all estimates are based on this assumption.
Why do you separate high and low points? What is the threshold for high/low division of points?
You can filter measurements that originate at street level. We can adjust the cutoff height for the included vs. excluded measurements in light of the standard deviation of the X,Y,Z.
What’s the difference between PS and DS data?
PS stands for Persistent Scatterer, typically originating from a dominant scatterer within a resolution cell of a radar image. DS stands for Distributed Scatterer: in the absence of a single dominant scatterer within a resolution cell, we sample the signal of neighboring cells as well and average the signal.
Can I use my own aerial photos as a background?
Yes, if you supply your own aerial photos, preferably in .tiff format, we can put them in the viewer and overlay these photos with the deformation data.
Can I supply my own map-layers, such as building outlines, location of pipes, etc.?
Yes you can add your map layers into SkyGeo Maps and then query the data based on their position relative to the objects in this layer.
How precise is the location and height of the measurements?
The standard deviation of location and height of the measurement points is 1 meter for high resolution date and 2.5 meter for standard resolution data. So InSAR is particularly useful for monitoring dynamic position changes.
Why is there a measurement point on this building/street/tree here, but not on a similar building/street/tree next to it?
Which objects we measure depends on:
- The way the objects reflect the radar signal to the satellite. The reflections from buildings and other solid infrastructure are generally good.
- The consistency of the reflections over time. We measure with mm-precision, so to be sure we are measuring the same object every time the reflections have to be consistent in time. Vegetated surfaces are therefore hard to measure; a tree moving because of the wind is not constant enough.
- The satellite we use.
Can I use SkyGeo data for my own GIS system?
Yes, you can download the data for your own system.